Alex Cheong Pui Yin
Previously covered recruitment-related stories and had a short stint as a copywriter for the property industry. She subsequently developed an interest in investment and robo-advisors.

17th January 2022 - 3 min read
Malaysians may need to pay more for dry goods and clothing in 2022 as manufacturers are expected to increase the price of these items by up to 10% due to various growing costs, as well as international trade issues.
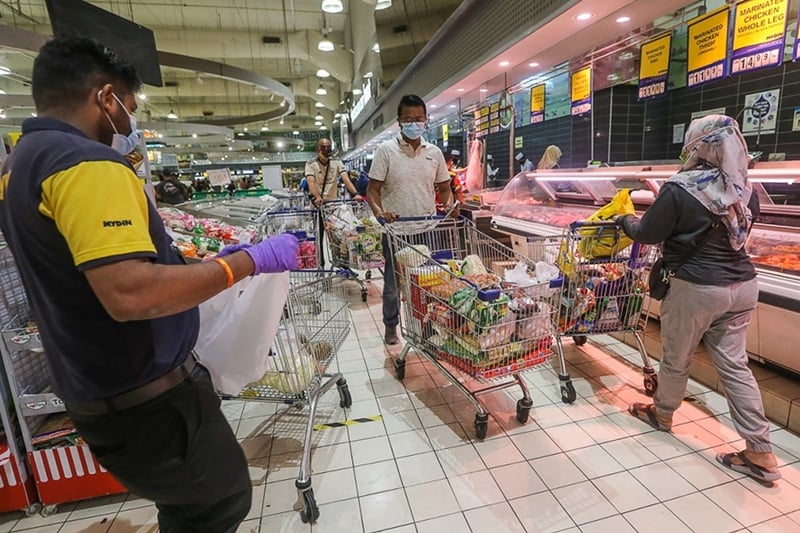
According to the managing director of hypermarket and retail chain Mydin, Datuk Ameer Ali Mydin, the price of dry goods – such as biscuits, sardines, and Milo – may increase by 8% to 10% this year. “We were told by many manufacturers that products will increase due to certain reasons (such as) the prices of raw material and logistics costs having increased,” he said.
On top of that, clothing prices, too, could see a surge of between 10% to 15% with new incoming stocks. In fact, the market prices for school bags and shoes have already gone up, said Datuk Ameer. Prices of wet items, on the other hand, are expected to stabilise.

Aside from that, Datuk Ameer also advised consumers to find ways to shop smart. “We have to be wise, smart to find products that we can afford. Because you have no choice. The product (price) will increase, your salary does not increase. Even if your salary increases, it is 3% to 5%, but the product (price) increases by 10%,” he said, sharing shopping tips such as opting for unbranded clothes instead of more expensive branded items.
Datuk Ameer further stressed that Malaysians should not blame these price increases on the government as Malaysia is involved in international trade. As such, its economy will be impacted by any international trade issues that crop up.
Prior to Datuk Ameer’s comments, several associations – particularly those in the F&B industry – have already stepped up to say that Malaysians can expect to pay more for their purchases this year. Beverages at kopitiams, for instance, may see a price increase of up to 60 sen. Some restaurants may also be forced to reduce their food serving sizes to cut cost.

Meanwhile, consumer financial expert Prof Mohamad Fazli Sabri chimed in to comment that household spending will be significantly affected when the prices of goods begin to rise between 10% to 30%. To illustrate, a family that usually spends around RM2,000 per month month will need to spend up to RM600 more for their usual purchases each month – equivalent to 30% increase in expenses.
Consequently, Prof Fazli said that households should change their lifestyle to cope with these price hikes, such as by reducing their non-essential purchases. Malaysians can also explore the gig or digital economy to supplement income if prudent spending isn’t enough to help with the situation. Additionally, the government can also improve the situation by being firmer in monitoring price hikes and by assisting individuals who are affected by the rise in living costs, he said.
(Sources: Malay Mail, The Star)
Previously covered recruitment-related stories and had a short stint as a copywriter for the property industry. She subsequently developed an interest in investment and robo-advisors.


Subscribe to our exclusive weekly newsletter and we’ll bring you the week’s highlights of financial news, expert tips, guides, and the latest credit card and e-wallet deals.
Stay tuned for what’s to come next in the personal finance world


Comments (0)