Alex Cheong Pui Yin
Previously covered recruitment-related stories and had a short stint as a copywriter for the property industry. She subsequently developed an interest in investment and robo-advisors.

14th July 2020 - 7 min read
Last week, the Department of Statistics Malaysia (DOSM) released the Household Income And Basic Amenities Survey Report 2019, as well as the Household Expenditure Survey Report 2019. Both reports serve to help the government gain a better understanding of the income distribution among Malaysian households and their spending patterns.
Given that both surveys were last conducted a while back in 2016, the updated figures in these reports are key for a clearer perception of the people’s current needs.
Here are some key highlights of the reports that you should take note of:
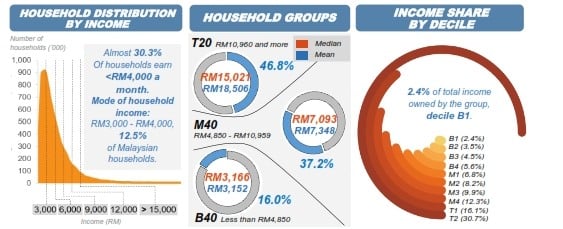
DOSM has increased the income threshold for the B40, M40, and T20 household groups based on the latest survey findings. The new income range for the groups are as follows, compared to its earlier range in 2016:
|
B40 |
M40 |
T20 |
|
| 2019 income range |
<RM4,850 |
RM4,850 – RM10,959 |
>RM10,959 |
| 2016 income range |
<RM4,360 |
RM4,360 – RM9,619 |
>RM9,619 |
Accordingly, the median income for the groups have also been updated from 2016’s figures, with B40 increasing from RM3,000 to RM3,166, M40 from RM6,275 to RM7,093, and T20 from RM13,148 to RM15,021.
On top of these updates, the B40, M40, and T20 income groups were also further broken down into another total of 10 sub-categories for better implementation of targeted assistance programmes by the government. B40 and M40 are both divided into another 4 sub-categories each, whereas T20 is made up of another 2 sub-categories. Here are the sub-categories and their corresponding household incomes:
| Income group | Sub-groups | Household income |
| B40 | B1 | Less than RM2,500 |
| B2 | RM2,501 to RM3,169 | |
| B3 | RM3,170 to RM3,969 | |
| B4 | RM3,970 to RM4,849 | |
| M40 | M1 | RM4,850 to RM5,879 |
| M2 | RM5,880 to RM7,099 | |
| M3 | RM7,110 to RM8,699 | |
| M4 | RM8,700 to RM10,959 | |
| T20 | T1 | RM10,960 to RM15,039 |
| T2 | More than RM15,040 |
(Image: Reuters)
The latest statistics from the survey indicated that the overall household income in Malaysia has increased since 2016 – for all the main ethnic groups, as well as in both rural and urban areas (strata).
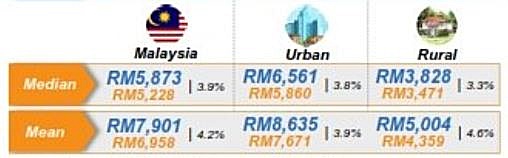
According to the report, the median of household income for the nation in general has grown by 3.9%, from RM5,228 in 2016 to RM5,873. Meanwhile, the mean household income rose from RM6,958 to RM7,901 – a growth of 4.2%.
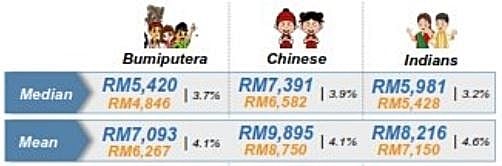
In terms of ethnic groups, Chinese households recorded the highest increase in median household income at 3.9%, followed by bumiputera households at 3.7% and Indian households at 3.2%. The mean income for Chinese households also saw a 4.1% increase, followed by bumiputera households at 4.1% as well, and by Indian households at 4.6%. Here’s what it looks like in real value, with comparison data from 2016:
Meanwhile, the median household income for those in urban areas saw an increase of 3.8%, while those in rural areas went up by 3.3%. The mean household income for families in both urban and rural areas also recorded a growth of 3.9% and 4.6%, respectively. In real value:
DOSM’s report further noted that almost 30.3% of Malaysian households earn less than RM4,000 a month in 2019.

Households in Malaysia spent a monthly average of RM4,534 in 2019, an increase from RM4,033 in 2016. This translates to a monthly growth of 3.9% per annum since 2016, which is in tandem with the moderate growth of mean monthly household income at 4.2% for the same period.
DOSM also noted that household expenditure in urban and rural areas increased by 3.7% and 3.6% per annum, respectively. This translates to the following:
|
Household expenditure according to strata |
||
|
2019 |
2016 |
|
| Urban |
RM4,916 |
RM4,402 |
| Rural |
RM3,038 |
RM2,725 |
In terms of expenditure pattern, households in urban areas recorded the highest percentage of expenditure at 24% for housing, water, electricity, as well as gas and other fuels. The highest expenditure for households in rural areas, in contrast, are for food and non-alcoholic beverages, at 24.4%.
(Image: Hari Anggara/Malay Mail)
Unfortunately, the report also indicated that there has been an overall increase in income inequality between the rich, middle class, and poor within the nation. The data is calculated based on the people’s gross income (before deducting tax and other contributions) and disposable income (after deducting tax and other contributions), and is measured using the Gini coefficient. Simply put, a higher Gini coefficient value means higher inequality in income.
Here is a comparison of the Gini coefficient value for Malaysia’s gross income and disposable income in 2016 and 2019:
|
Gini coefficient value for Malaysia |
||
|
2019 |
2016 |
|
| Gross income |
0.407 |
0.399 |
| Disposable income |
0.393 |
0.391 |
Of note also is the income gap that exists for the different ethnic groups and for those living in rural and urban areas.
According to DOSM, the household income gap based on gross income has widened for all ethnic groups since 2016. Calculations based on disposable income, however, indicated that the income gap has shrunk between bumiputera households since 2016, despite having increased for both Chinese and Indian households. Here’s a summary of it:
|
Gini coefficient for ethnic groups |
||||
|
Gross Income |
Disposable Income |
|||
|
2019 |
2016 | 2019 |
2016 |
|
| Bumiputera |
0.389 |
0.385 | 0.377 |
0.38 |
| Chinese |
0.417 |
0.411 | 0.399 |
0.396 |
| Indian |
0.411 |
0.382 | 0.399 |
0.372 |
For those living in urban and rural areas, calculations based on gross income showed a widening of household income gap for both categories since 2016. When measured based on disposable income, data showed that the income gap for households in urban areas has increased slightly from 2016, whereas households in rural areas saw a decrease instead.
|
Gini coefficient for strata |
||||
|
Gross Income |
Disposable Income |
|||
|
2019 |
2016 | 2019 |
2016 |
|
| Urban |
0.398 |
0.389 | 0.385 |
0.38 |
| Rural |
0.367 |
0.364 | 0.361 |
0.365 |
(Image: The Star)
The government has updated the poverty line income (PLI) to RM2,208 per month, in accordance with the mean value of the national PLI noted in the report. The PLI is simply defined as the minimum income considered necessary to survive in a particular country.
The new PLI figure was calculated based on the 2019 methodology, which emphasises healthy eating and quality non-food basic needs. Prior to this, the PLI was obtained via the 2015 methodology, which was based on minimum food requirements and other basic needs of each household member. It was set at RM980 in 2016.
In addition to that, the report also observed that the incidence of absolute poverty has improved from 7.6% in 2016 to 5.6% in 2019. In short, absolute poverty happens when a household’s gross monthly income is insufficient to maintain basic living standards according to the PLI.

Similarly, the country’s rate of hardcore poverty, too, has improved, reducing from 0.6% in 2016 to 0.4% in 2019. Hardcore poverty depicts a harsher living condition, where the gross monthly income of a household is lesser than half of the PLI.
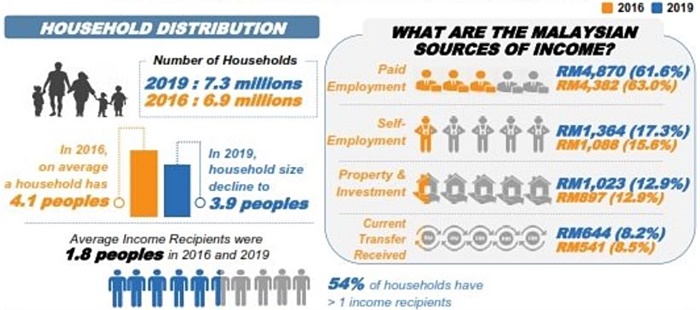
More people have turned to self-employment in 2019, with 17.3% Malaysians now working on their own – compared to 15.6% in 2016. Correspondingly, the number of those in paid employment has decreased from 63% in 2016 to 61.6% in 2019.
Aside from that, the number of Malaysians earning their income from property and investments saw no change, remaining at 12.9% since 2016. Another 8.2% obtained their income from monetary transfers such as remittances, alimony, pension, and other assistance in 2019 – a slight decrease from 8.5% in 2016.
***
According to DOSM, these latest reports are expected to be more impactful and precise as they have been updated with new criteria, such as a more refined classifications of households.
For more information, you can read the full Household Income & Basic Amenities Survey Report 2019 and Household Expenditure Survey Report 2019 here, or check out DOSM’s infographics on its official Facebook page.
Previously covered recruitment-related stories and had a short stint as a copywriter for the property industry. She subsequently developed an interest in investment and robo-advisors.


Subscribe to our exclusive weekly newsletter and we’ll bring you the week’s highlights of financial news, expert tips, guides, and the latest credit card and e-wallet deals.
Stay tuned for what’s to come next in the personal finance world


Comments (0)